Views: 32
The level and trends in inequality include numerous parameters, i.e. personal income before and after taxes/transfers, average and median household disposable incomes, relative poverty rates and poverty gaps, to name a few. Besides, there is another important part in combating inequality dealing with the “social exclusion”, i.e. inequality among different groups of citizens. So-called “gini coefficient” provides a relatively trustful data on inequality in the EU and globally, which is good for scientists and decision-makers. But, national governance shall be doing more in reducing growing inequality…
Increasing social stratification in modern societies is apparently both growing and alarming. Although most countries are having in their strategic planning the issues of eradicating inequality, however the gap between poor and rich is still hardly significantly reducing during last decades. One of the reason is the acceptance of “freedom of being rich and successful” is becoming much more attractive modus vivendi; of course, the concept of “sick and poor” shall be excluded from the political economy’s patterns.
Modern governance with the expected “pursuit of happiness” (as is depicted in the US basic law) often lack sufficient resources at hand to so-called streamline the inequality’s eradication process; although “the happiness for all” and the general wellbeing concept shall be an utmost goal of any socio-economic development. Post-pandemic period has only additionally shown that inequality gap is being widely spread; however in the governance efforts all forms of inequality shall have a priority over other national goals (e.g. such as growing GDP) turning to sustainability and resilience.
European approaches
Already in 1994, the European Commission in its “white paper” called “Growth, competitiveness, employment” called the EU member states to take measures to combat all forms of exclusion and poverty, while mentioning that, first of all regarding different social status among men and women, that actually “splits society in two”.
However the political scene has changed, notably with the introduction of an open method of coordination in the fields of social inclusion and pension’s reform. Other important changes included enlargement of the EU from 15 to 25 and then, presently to 27 states (and demands for coverage of other neighbouring countries), and the publication by the United Nations expert group on household income statistics of a detailed report and recommendations.
After 2007, when regulations became fully applicable, a special data service, i.e. “EU-SILC” (European statistics on income and living conditions) becomes a normative source of reference in statistics on income and social exclusion among the EU states.
Source: Data on Income and Living Conditions come from the EU-Statistics on Income and Living Conditions (EU-SILC) data collection, in:
https://ec.europa.eu/eurostat/web/income-and-living-conditions/data
Inequality’s legal aspects
Presently valid EU’s basic law, the Treaty of Lisbon was signed by the EU heads of state in 2007, though entered into force at the end of 2009, following some drafts of the “European constitutional treaties” to consolidate all previous EU agreements and treaties.
The Treaty of Lisbon (which consists of two main parts, the TEU and TFEU) confirmed the Union institutions’ power to act in areas such as human rights, judicial and foreign policy; besides, it re-emphasized the idea that every citizen of also a EU citizen.
One of the first articles in the TEU is worth citing in full, as it confirms EU member states’ “common actions” in the European values:
“The Union is founded on the values of respect for human dignity, freedom, democracy, equality, the rule of law and respect for human rights, including the rights of persons belonging to minorities. These values are common to the member states in a society in which pluralism, non discrimination, tolerance, justice, solidarity, and equality between women and men prevail”.
Another Treaties’ article 3 lists the EU’s integration objectives: “the Union’s aim is to promote peace, its values and the well-being of its people”.
Income levels as well as the living conditions are some of the basic pre-conditions to evaluate national governance’s ability of being engaged in truly social priorities and contributing to reduction of inequality and promoting inclusion.
Present Union’s integration efforts are based on 10-year basic planning strategy (known as EU-2020 strategy): in 2000 the EU member states approved socio-economic development goals to be achieved by 2010. The Strategy, for example, confirmed five headline targets to constitute shared objectives guiding the action of member states regarding promotion of employment, improving the conditions for innovation, research and development, meeting the EU climate change and energy objectives, improving educational levels, and “promoting social inclusion in particular through the reduction of poverty”. This specific “poverty reduction” headline target has been focusing on lifting at least 20 million people out of risk of poverty and social exclusion.
Progress towards this target for the EU states has been monitored on the basis of three main indicators: people at-risk-of poverty, material deprivation, and combating unemployment.
Using data from EU-SILC, the member states are able to set national targets on the basis of the most appropriate indicators, taking into account their national circumstances and priorities.
The ever increasing relevance of EU-SILC data is directly linked to the increasing request for clear and easily accessible information on the inequality issues, the calculation of available national indicators and quality of information.
It is worth noting that when the idea of poverty reduction target was first officially introduced by the President of the European Commission in 2010, the focus was on those “at risk of poverty” as captured simply by the relative poverty measure; the approach was underlined in Laeken Declaration on “Social Inclusion Process Indicators” since they were adopted in Laeken.
With about 80 million people in the EU being “at risk of poverty” on this basis in 2008, the initial proposal was for a targeted reduction by one-fourth, or 20 million persons.
However various member states were not satisfied with the initial proposal and the formulation eventually agreed has been significantly different: finally, the target has been less ambitious involving a reduction of one–sixth in the number at risk of poverty and exclusion.
However, through expanding the indicators beyond the relative income poverty to include material deprivation and household joblessness the target has had a significant impact on national priorities. Although the EU states are free to approve national priorities in their own targets and policies, but they have to demonstrate to the EU institutions and bodies how the states would contribute to the achievement of the overall EU-wide targets. Thus, the way the target population is identified has potentially a major implication for the national policies and strategies in implemented measures to combat inequality.
More in: https://ec.europa.eu/eurostat/web/income-and-living-conditions/data.
At the end of 2020, some new data have been available reflecting inequality and income distribution in numerous world states and in some of the EU countries: Austria, Belgium, Czech Republic, Estonia, France, Greece, Hungary, Latvia, Lithuania, Luxembourg, Poland, Portugal, Slovak Republic, Slovenia and Spain (income year 2018), Denmark (income year 2017) and Iceland (income years 2016-17).
Table: Situation in the Baltic States, Scandinavia and other EU countries (data for 2017)
In Lithuania, the Gini*) coefficient is 0.374; top 20% vs. bottom 20% – 7,4; relative income poverty (rip) – 0,17.
In Latvia, the Gini coefficient is 0.355; the top-bottom difference – 6,7; and the rip is the same as in LT -0,17.
In Estonia, all the indicators are slightly better: Gini – 0.309, the top-bottom figure – 5.2, and rip – 0.16.
In Poland, the Gini coefficient is 0.275, top-bottom 20% difference – 4.2, and rip – 0.10.
In Denmark, the Gini coefficient is 0.264, top-bottom 20% relationship – 3.8, and rip – 0. 06;
In Sweden, Gini coefficient is 0.282, top-bottom figure is 4.2, and rip – 0.09;
In Finland, the Gini data is 0.266, the top-bottom figure – 3.8, and rip- 0.06;
In Germany, the Gini coefficient – 0.289, top-bottom 20% data – 4.5, and rip – 0.10.
In Iceland – Gini data is generally 0.250, top-bottom figure – 3.5, and rip – 0.05.
Other inequality trends in the EU states (as well as in Finland) can be seen, e.g. at:
https://wid.world/country/finland/
*) Note: in economics, the Gini coefficient, sometimes called the Gini index or Gini ratio, is a measure of statistical dispersion intended to represent the income inequality or wealth inequality within a nation or any other group of people. It was developed by the Italian statistician and sociologist Corrado Gini.
The Gini coefficient measures the inequality among values of a frequency distribution (for example, levels of income). A Gini coefficient of zero expresses perfect equality, where all values are the same (for example, where everyone has the same income). A Gini coefficient of one expresses maximal inequality among values: e.g., for a large number of people where only one person has all the income or consumption and all others have none, the Gini coefficient will be nearly one. Gini coefficients of income are calculated on market income as well as disposable income basis. The Gini coefficient on market income (sometimes referred to as a pre-tax Gini coefficient) is calculated on income before taxes and transfers, and it measures inequality in income without considering the effect of taxes and social spending already in place in a country. The Gini coefficient on disposable income (sometimes referred to as after-tax Gini coefficient) is calculated on income after taxes and transfers, and measures inequality in income after considering the effect of taxes and social spending already in place in a country.
Reference to: https://en.wikipedia.org/wiki/Gini_coefficient
Quite specific is the situation in Norway, which is not a EU member state, through the figures are inspiring: e.g. the states’ Gini coefficient is the lowest in Nordic countries with 0.262, the top-bottom 20% relation – 4.0, and rip – 0.08 (second lowest in Scandinavia after Iceland).
It has to be concluded, that Nordic countries represent quite an example of growth pattern to emulate for other regions in Europe…
Social exclusion: income and living conditions in Europe
The term “social exclusion” is usually attributed to Rene Lenoir, then Secretary of State for Social Action in the Chirac government, who published Les Exclus: Un Francais sur dix, in 1974. The author however excluded from “inequality” some social groups, e.g. handicapped, suicidal and aged people, abused children, etc. which counted for about 10 per cent of the French population; all these social categories have been unprotected under social insurance.
The term gained popularity in France during the 1980s, the period of economic crisis and restructuring, at a time of the crisis of the welfare state coped with other social and political crises.
The term exclusion was used to refer to various types of social disadvantage, related to arising new social problems such as increased unemployment, “ghettoisation” and fundamental changes in family life.
Old welfare state’s provisions were thought incapable of dealing with these problems, and new social policies have been part of a “social market” development, at least in Europe.
Reference to: https://ec.europa.eu/eurostat/documents/1012329/1012398/D5.1.3-Working_paper_final_20141204-QfyCdr1I.pdf.
Inequality globally…
The level of inequality, as well as the trends in Gini coefficients globally, include numerous parameters, i.e. personal income before and after taxes/transfers, average and median household disposable incomes, relative poverty rates and poverty gaps, to name a few. These complexities often are accredited to the deficiency in the states’ efforts towards priorities in combating inequality.
The OECD Income Distribution Database – one of the most reliable in the world – offers inquisitive researchers all necessary information on global inequality; besides, due to the increasing importance of such issues as income inequality and poverty issues in policy discussion, the database is now annually updated.
Main reference to: http://www.oecd.org/social/income-distribution-database.htm?utm_source=Adestra&utm/21.01.2021
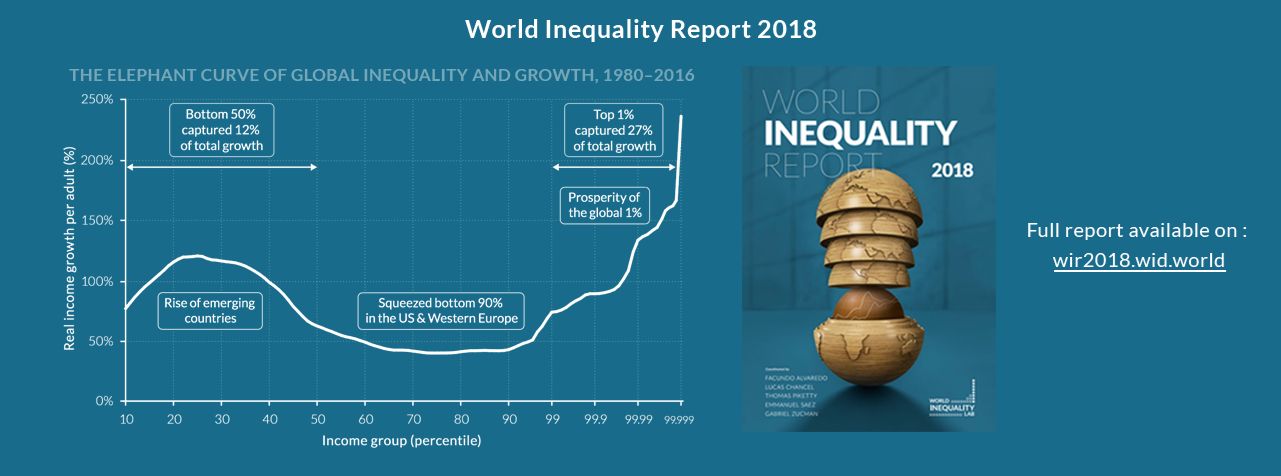
The trend in global inequality and growth features a very dissatisfactory picture: half the “bottom” population in the world is having only 12 percent of global wealth; while top ONE percent of global population “captures” 27 percent of the total global wealth. The latest available figures are seen in the table below; main source in: https://wid.world/; wir2018.wid.world.
Inequality is a factor of the “quality of life” and healthy consumption, of which the tobacco is a damaging issue. The total number of smokers globally rose to over one billion recently (according to The Guardian); and killed almost eight million people in 2019 (the data published in a medical magazine Lancet).
Preventive measures should be addressed on young people as about 90 percent of new smokers were addicted by the age of 25; people over that age are unlikely to start.