Views: 73
In September 2019, the Commission issued analytical factsheets revealing in more details the perspectives (with nine specific objectives) for the common agricultural policy (CAP) after 2020. This analysis provides an overview of the agricultural sector and rural development in the EU member states (about 1,6 MB in each) based on the agreed specific objectives and the CAP indicators that are used to measure the performance of the states’ agricultural policy. In addition, the article includes a comparison of two states’ agro-efforts in the Baltic Sea region: the most affluent (Denmark) and the weakest (Latvia).
Generally, the European agricultural policy includes the following main aspects: a) food safety and quality (with such issues as agro-products’ certification, labeling and standards, health and safety, packaging and transport, monitoring and control, regional and international agreements), b) farming (with international cooperation issues, organic farming and young farmers, coronavirus response’s issues), c) forestry (with multifunctional forests and agro-forestry), d) sustainable agriculture (with modernising agriculture, as well as with social, economic and environmental sustainability issues), e) plants and plant products (with seeds and reproductive materials, plant variety issues, live plants and flowers, fruits and vegetables, pesticides and genetically modified organisms, GMO; as well as plant health); f) fisheries and oceans (with such issues as fishing quotas, illegal fishing, aquaculture, blue economy and international ocean governance); g) animals and animal products, including transport and handling, monitoring and control; h) trade issues, including international agro-food trade analysis, agricultural markets and prices, trade with the non-EU countries.
Besides, there are several sectoral “key policies” in the EU, i.e. Common agricultural policy, Common fisheries policy, Future European food safety, General food legislation and so-called blue economy strategy. Source: https://ec.europa.eu/info/food-farming-fisheries
CAP: Past and present
During the whole EU CAP’s history there have been several attempts to make changes and reforms, starting, e.g. from reform packages in 1968 and 1972. Reforms, in fact, have been adopted regularly by the EU Council, upon proposals from the EU Commission, i.e. almost every four years, since 1985. For example, after a wide-range public debate the Commission presented to the states in November 2010 a Communication on “The CAP towards 2020”, which outlined options for the future CAP and launched the debate with the interested stakeholders.
Rural area – about 90 % of the EU-27 territory and is home to over 50% of EU population; A single funding and programming instrument: European Agricultural Fund for Rural Development (EAFRD). Once the Commission decided (somewhere around 2005) that the member states were obliged to spend out of national budgets: a) 10 % on improving the competitiveness of agriculture and forestry, b) 25 % on the environment and countryside, c) 10 % on improving quality of life in rural areas and diversifying the rural economy, and d) 5 % on the Leader approach (specific rural programs). See, e.g. Regulation No 1698/2005 (OJ L 277, 21.10.2005).
Presently, the average agro-food share in the EU’s GDP is about 2-3 percent; the sector accounts for some 5-7 % of the employed civilian working population. The role of food-stuff, e.g. foods, beverages and tobacco has accounted for about 20 % of average EU household consumer expenditures. However, economic importance of agriculture is much greater than its share in the Union’s GDP: agro-sector (incl. beverages) accounts for more than 14% of the EU total manufacturing output (about € 700 bln worth of production); EU agro-export is worth over € 62 billion a year.
About one third of all the EU legal acts are devoted to CAP; out of about 5 thousand EU Court decisions, more than a thousand is directly or indirectly concerned with CAP issues. More than 40 per cent of the EU aggregate budget is devoted to CAP; initially, the share of budget devoted to CAP was about 70 %.
The future of the agro-food sector in the post-pandemic Europe is an important part of modern integration efforts: both scientists and policymakers are working create a more resilient and sustainable agro-food strategy. As to the EU, the European Green Deal, the Farm to Fork Strategy and the finalization of the CAP reform are the focal points in the arsenal of policy tools in dealing with the sector’s modern challenges and making Europe’s agro-food sector climate-efficient, innovative and competitive.
The fifth in a row this year’s agro-food summit (took place in mid-September in Paris) underlined the impact of the EU policy instruments and technological advancement on the sector’s ability to bounce back from a grueling pandemic, while including other issues to moderate, including climate change, evolving international trade complexities, protection of food security, animal welfare, biodiversity, etc.
https://www.politico.eu/agrifood-summit/
For example, food labeling and transparency, argued Claire Bury, deputy director-general, DG SANTE, European Commission, is presently the most important issue in agro-food. Thus, the Commission ensures quality and safety of agro-food products, supporting producers and promoting sustainable practices Reference to: https://ec.europa.eu/info/food-farming-fisheries.
New CAP for 2023-27
In June 2021, the three main EU institutions (the European Parliament, the Council of the EU and the European Commission) agreed on the reform of the common agricultural policy (CAP). This provisional political agreement paves the way for the formal approval of the necessary legislation by the European Parliament and the Council in the autumn of 2021.
The new CAP, which starts in 2023, aims to foster a sustainable and competitive agricultural sector that can support the livelihoods of farmers and provide healthy and sustainable food for society, as well as vibrant rural areas.
Agriculture and rural areas are central to the European Green Deal, and the new CAP will be a key tool in reaching the ambitions of the EU’s “farm to fork” and biodiversity strategies.
The CAP’s long-term budget features the following main figures:
= €387 billion in CAP funding for 2021-27; the CAP will continue to be supported by two funds: a) the European agricultural guarantee fund (EAGF) has been set at €291.1 billion; and b) the European agricultural fund for rural development (EAFRD), including the Next Generation EU funding, will amount to €95.5 billion.
= Up to €8 billion will go to CAP from Next Generation EU; the budget for the EAFRD includes €8 billion from Next Generation EU to help rural areas make the structural changes necessary to achieve the goals of the European Green Deal and digital transition.
= Up to 25% transfer between income support and rural development. In order for the EU states better adapt the policy to their farming sectors’ priorities; they will have the option to transfer up to 25% of their CAP allocations between income support and rural development. EU countries can apply additional flexibilities for certain specific purposes, such as supporting environment and climate objectives, supporting young farmers and where countries have below-average direct payments. See: Communication, June 2018 –COM 2018, 392 final.
The perspective CAP’s timeline looks the following way:
= In 2024, each EU country will present an annual performance report and hold an annual review meeting with the Commission.
= In 2025, The Commission will undertake a first performance review of each CAP strategic plan and request – if necessary – specific follow-up actions to EU countries.
= In 2026 an interim evaluation will assess the performance of the new CAP.
= In 2027, the Commission will undertake a second performance review of each CAP strategic plan. Source:
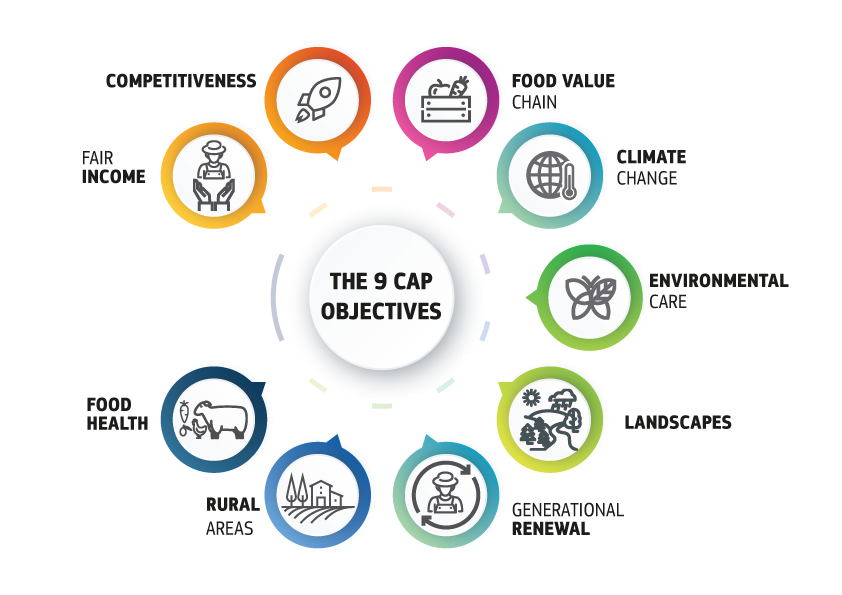
Nine key objectives
For the period 2023-27, the common agricultural policy (CAP) will be built around nine key objectives. Focused on social, environmental and economic goals, these objectives will be the basis upon which EU member states design their CAP strategic plans.
The objectives are: – to ensure a fair income to farmers; – to increase competitiveness; – to rebalance the power in the food chain; – climate change action; – environmental care; – to preserve landscapes and biodiversity; – to support generational renewal; – vibrant rural areas; and – to protect food and health quality.
Interesting enough, that a decade old CAP strategy included “just” 5-6 “improving guidelines”: a) improving the competitiveness of the agricultural and forestry sectors; b) improving the environment and the countryside; c) improving the quality of life in rural areas and encouraging diversification; d) building local capacity for employment and diversification; and e) translating priorities into programs (!?).
Comparisons: Denmark-Latvia
In Latvia, the agricultural income per worker is on average 51% of the average wage in the whole economy (data from 2005-2018); it ranged gradually from 63% in 2012 to 38% in 2009. At the EU level, the gap between the agricultural income and the average wage in the economy seems to be closing over time. The average agricultural factor income per worker in Latvia has been around € 4.720 between 2005 and 2018. Agricultural factor income per worker is steadily increasing in Latvia up to € 5.700 in 2018. Direct payments’ share is about 41% of the total agricultural income; while payments under Pillar II are on average 15% of the income.
As to agro-food trade balance in Latvia, it is in balance (with a slight deficit in 2018): it has positive trade balance with countries outside the EU, which is increasing during 2008-2017; however, the intra-EU trade (with other EU states) is negative. The main export product to non-EU countries are spirits and liqueur (41.6% in value in 2018), wine, vermouth, cider and vinegar (18.8%) and wheat (13.6%).
The total number of farms in Latvia decreased during 2005-2016 from about 128 700 to 70 000 farms; though the average farm size doubled between 2005 and 2016 from 13 hectares to 28 hectares. The agricultural area increased between 2005 and 2016 by 11% from 1.73 million to 1.93 million hectares. Arable land increased by 18% during this time whereas the area with permanent crops decreased by 41%. The total number of livestock units increased between 2005 and 2016 from about 456 000 to 499 000. The livestock density (calculated as total number of livestock units (LU) in agricultural area) remained stable at 0.26 LU/ha. The agricultural area of extensive grazing (area under grazing livestock production below 1 LU/ha of forage area) decreased a little from 57% in 2005 to 55% in 2013.
During the last decade, the number of farms reduced by half, whereas average farm size almost doubled.
The share of the value added in the food chain for primary producers fluctuated between 30% in 2008 and 40% in 2012 between 2008 and 2015. Compared to 2008, the share for primary producers increased at the expense of food and beverage manufacturing and distribution. The share of the value added that goes to agriculture is higher than the EU-average (24%). In 2016, 34% of the value added in the food chain went to primary producers. Source: https://ec.europa.eu/info/sites/default/files/food-farming-fisheries/by_country/documents/analytical_factsheet_lv.pdf
In Denmark the entrepreneurial agricultural income per worker fluctuates strongly: out of last 13 years, 2 years were loss making, in 5 years the income was between 0% and 30% of the average national income and in only one year agricultural income was higher than 60% of the national average. The average agricultural factor income per worker was volatile during 2005-2018 and fluctuated between € 22.000 in 2008 and € 60.700 in 2012. Danish agriculture is highly performing in adding value but this does not reward the farmers for the remuneration of own production factors as the entrepreneurial income is quite lower than the agricultural factor income. Total factor productivity suggests the value added is used for wages of labour and debt servicing. On the other hand, the factor income is on average about € 36.000 in Denmark between 2005 and 2018.
The value added per worker is above average for arable crops; income per size of farms shows that income per worker generally increases with farm size. The share of direct payments in income fluctuated in Denmark from about 30% in 2012 to 56% in 2016.
The trade balance in Denmark is positive and stable; it was positive with countries outside the EU and inside the EU. Denmark’ main export products are pork meat (14.6%), cheese (9.8%) and live animals (7.2%).
The total number of farms decreased between 2005-2016 from about 50 000 to 35 000 farms (of which 10 000 full-time farmers, 17 500 part time farmers and 7 500 very small farms). The average farm size increased from 52 to 75 ha in the same time period. The agricultural area declined slightly in the same time period from 2.7 million hectares in 2005 to 2.6 million hectares in 2016.
The number of livestock units (LU) dropped between 2010 and 2016 from 4.9 million to 4.1 million; the livestock density showed a similar decrease. The share of the value added for primary producers in the food chain fluctuates over time in Denmark between 32.6% in 2012 and 20.5% in 2016. The share of the value added that goes to agriculture is close to the EU average; however, the cooperative organisation of Danish primary producers increases farmers’ earnings, as the Danish producers can be co-owners and also receive a portion of the earnings that belongs to the value added in “food and beverage manufacturing”.
Denmark showed an upward trend in the production of renewable energy (RE) from agriculture and forestry per hectare until 2010 after which the production flat lined or went down a little. The share of production of RE from agriculture and forestry is similar to the EU average. Around 50% of the total RE production is coming from agriculture and forestry; finally, the use of RE in agriculture and forestry in Denmark fluctuates around 10%. Source: https://ec.europa.eu/info/sites/default/files/food-farming-fisheries/by_country/documents/analytical_factsheet_dk.pdf
General data on other EU states in: https://ec.europa.eu/info/food-farming-fisheries/farming/facts-and-figures/performance-agricultural-policy/agriculture-country/cap-specific-objectives-country_en